g2r is an interface to the G2.js JavaScript visualisation library. G2.js is itself a Grammar of Graphics (GG ~= 2G) though some things differ from R’s common understanding of such grammar as implemented in ggplot2, some things will be similar to ggplot2 in places.
-
ggplot2::ggplot->g2 -
ggplot2::aes->asp -
ggplot2::scale_*->gauge_* -
ggplot2::geom_*->fig_* -
ggplot2::facet_*->planes_* -
ggplot2::theme_*->motif_*
The “localisation” or “translation” of the ggplot2 grammar is not just a gimmick it also allows avoiding having one package clash with the other.
Initialise
Like with ggplot2, one creates visualisations by layering figures (geometries) defined by aspects (aesthetics).
ggplot2
ggplot(cars, aes(speed, dist)) +
  geom_point() +
  geom_smooth(method = "lm")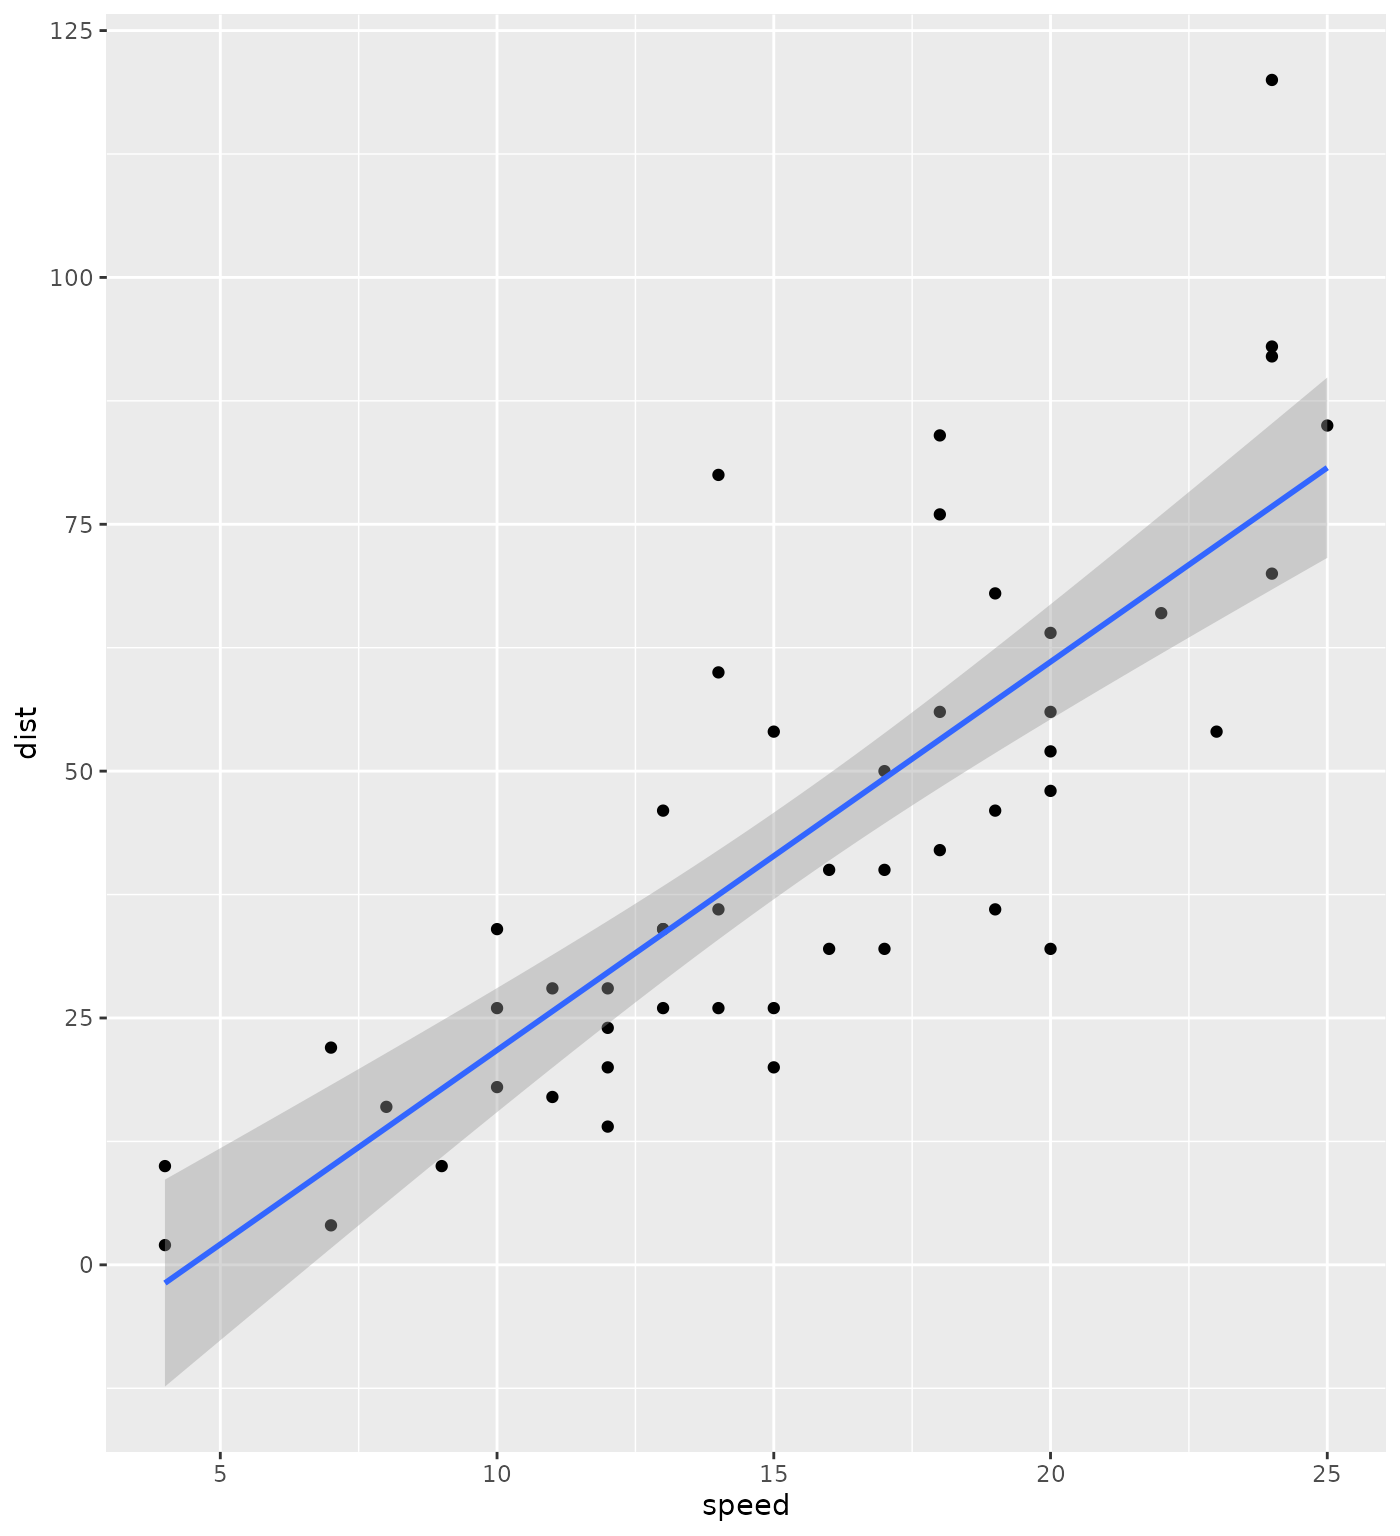
g2r
g2(cars, asp(speed, dist)) %>%
  fig_point() %>%
  fig_smooth()
Gauge
Similarly to ggplot2, axis of the visualisation can be modified with gauge_* (scales in ggplot2).
ggplot2
ggplot(iris,
    aes(Sepal.Length, Sepal.Width, color = Petal.Width)
  ) +
  geom_point(aes(size = Sepal.Width)) +
  scale_color_viridis_c()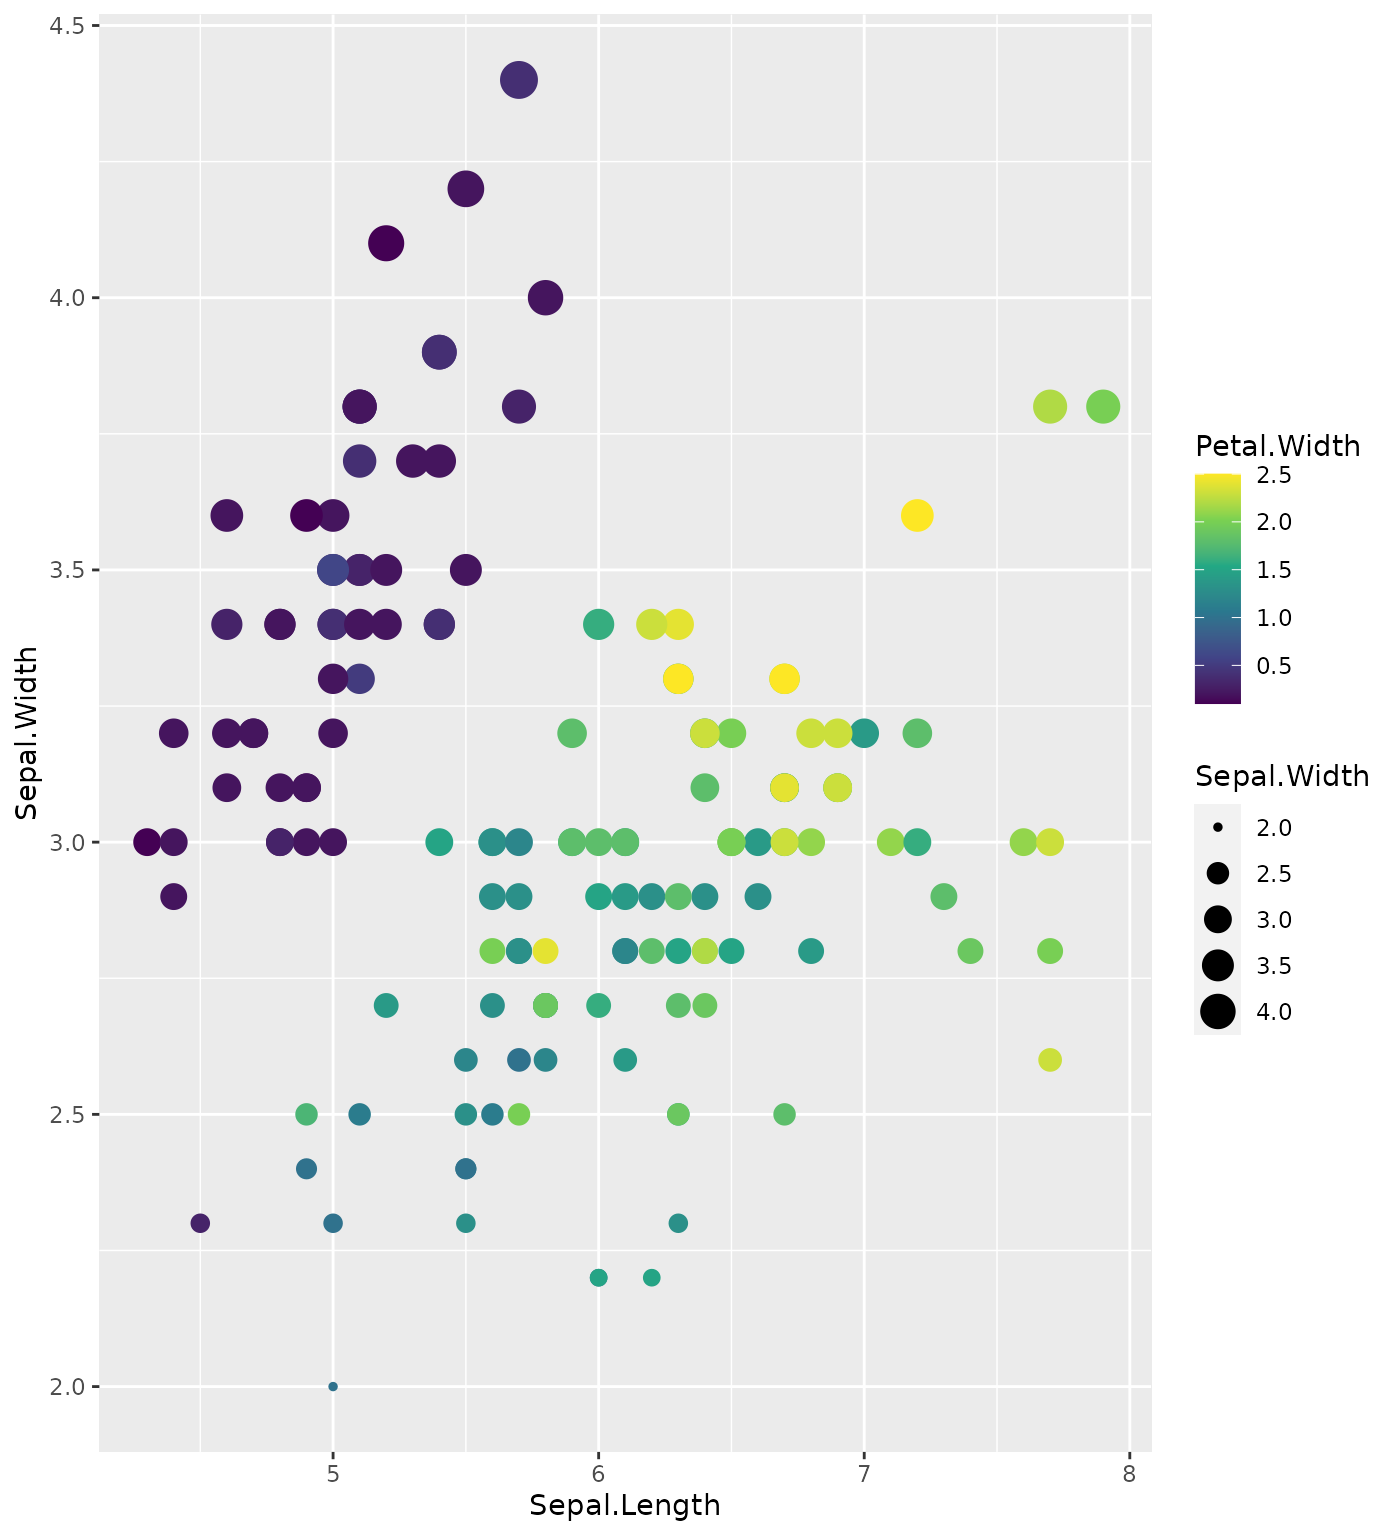
g2r
g2(iris,
    asp(Sepal.Length, Sepal.Width, color = Petal.Width)
  ) %>%
  fig_point(asp(size = Sepal.Width)) %>%
gauge_color_viridis()Aspects
As in ggplot2, other aspects of the visualisation can be defined. Unlike ggplot2 though, whether these aspects are columns from the data or constants they can only be specified within asp.
data(penguins, package = "palmerpenguins")ggplot2
ggplot(penguins,
    aes(bill_length_mm, bill_depth_mm, color = island)
  ) +
geom_point(aes(shape = island)) 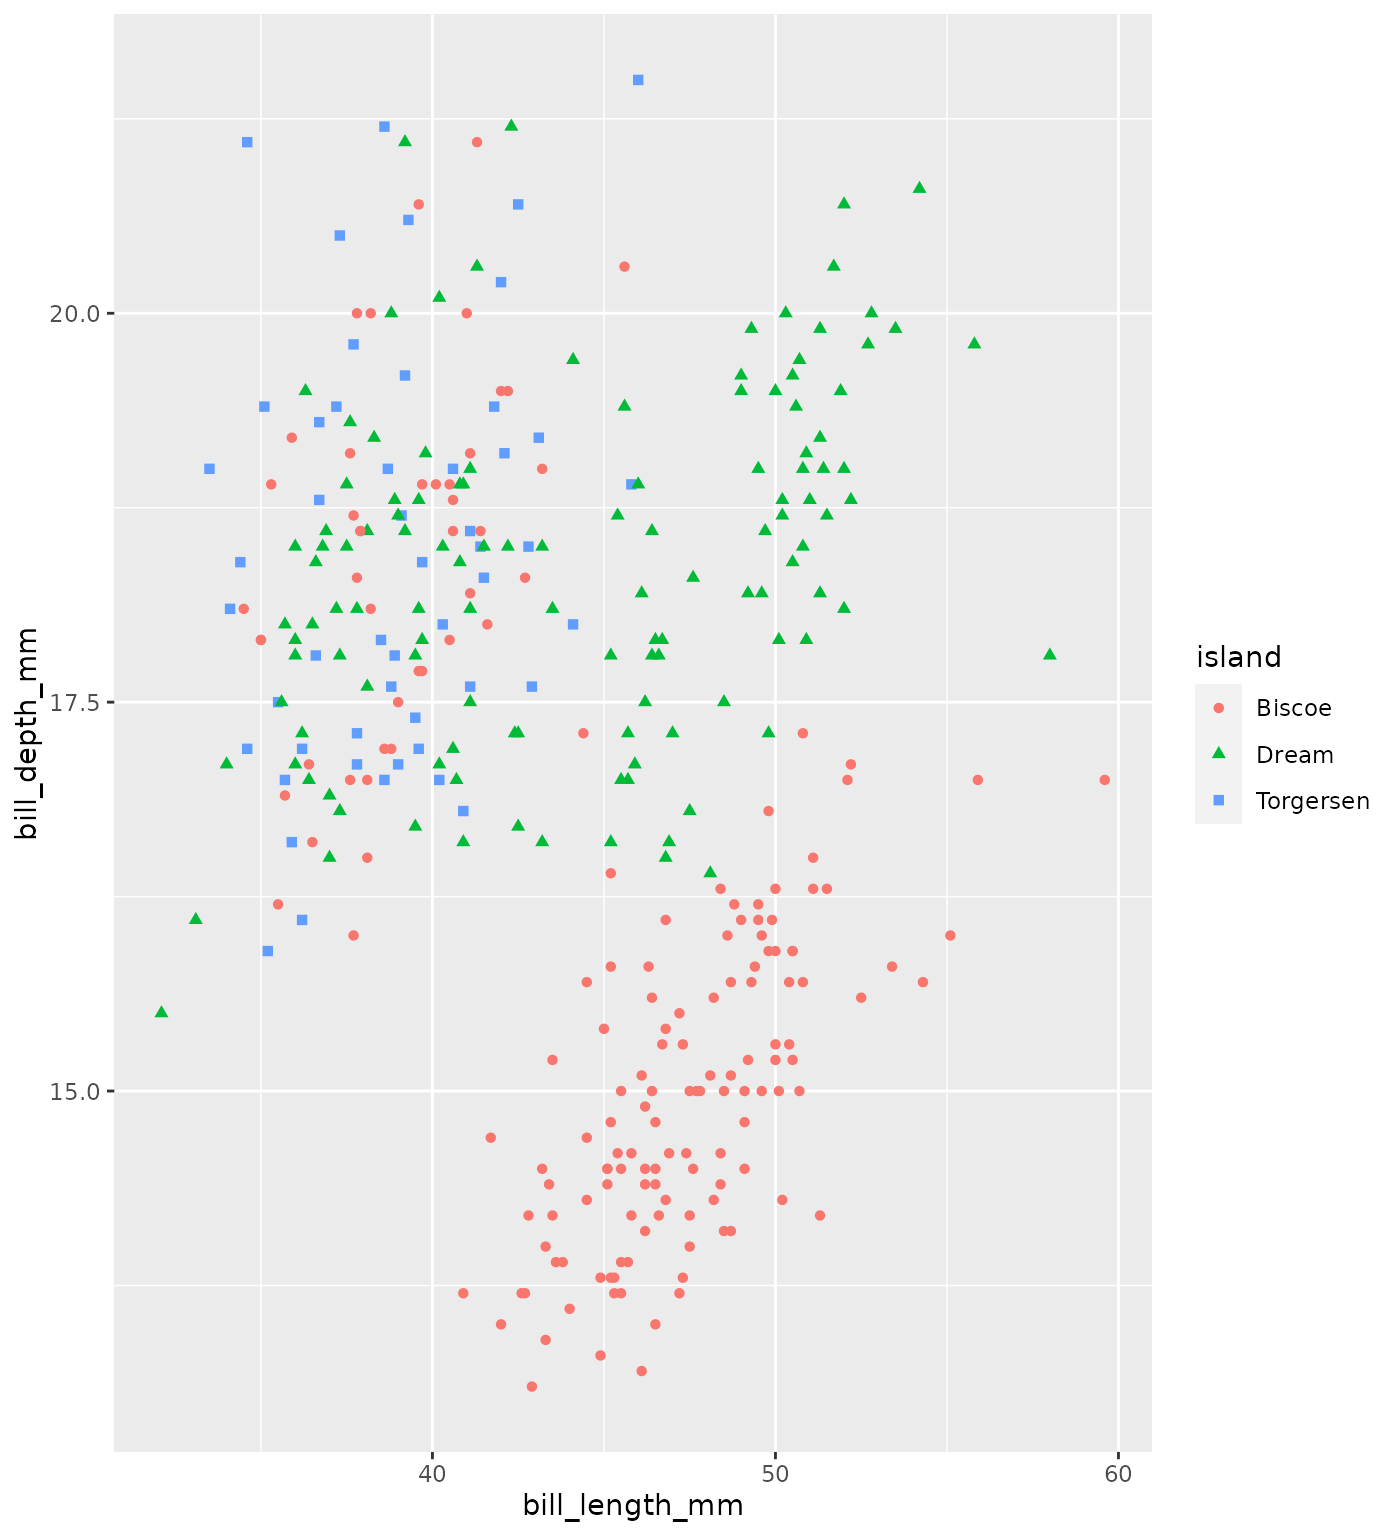
Color = Group
Where one might use the group aesthetic in ggplot2 one will want to use color in g2r; it’ll define both the colour and the group.
g2(iris, asp(Petal.Width, color = Species)) %>%
  fig_density()
Adjust
In order to stack bars, or place bars side-by-side, or jitter points one must use the adjust function.
Planes
G2r also comes with the equivalent of ggplot2’s facets, here they are named planes.
Quick plots
There is also a function to quickly draw plots based on the class of the object it receives: qg2.
Recipes
Generally g2r functions accept data in the form of data.frames or tibbles but it will attempt to transform other objects to (generally) data.frames.